Of course there will be other charts which will show otherwise. But in share trading, the main goal of the trader, imho, is to protect his capital+profits. If he doesn't do that- then eventually he would have lost the game.
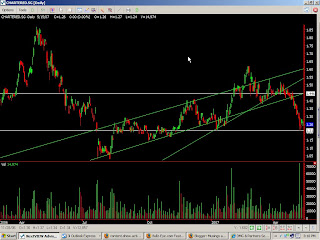
Chartered- it was a great graph last month. Plenty of good volume and support. So I got in at $1.45. But when the MD or CEO came out and said it wasn't involved in any takeover discussions and they had a piss-weak report- bang - should have got out. Trouble was already brewing on the chart- when it deviated from the trend line.
I started selling at $1.43 which was the correct thing to do. Then I got excited by the sudden last push towards $1.45 and got back in again. Eventually, I exited from my positions at the dismal price of $1.34 - left it too late. Its tempting to jump back in at this level $1.26. But for now, I'm leaving it alone. I'd say its a buy if it ever hits $1. But not a stock for long term holding.
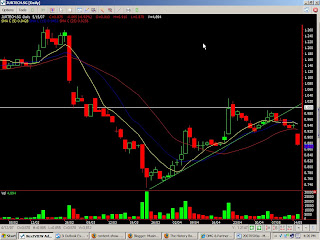
Jurtech- seemed quite interesting. I got in at 95 cents a few weeks ago. Straight away it powered to 98 cents and seemed to want to break pass $1.00. It didn't. I bailed at 95 cents, thankfully.
I don't mind holding the stock if it strays away from the straight line uptrend for a day or so- but any longer and I get nervous.


No comments:
Post a Comment